In this article, I’m going to suggest some ideas for working on the bar model from the Actilud.com website, which, once adapted to your classroom, will save you time and efficiency thanks to digital technology.
This article does not aim to explain in detail the educational interest of bar diagrams; there is a whole literature on that.
The additive bar diagram
Actilud.com, basic problems, B1: introduction to the diagram.
Take the time to examine the different possible parameter configurations. The one we’ll be using in this article is 4-1-3.
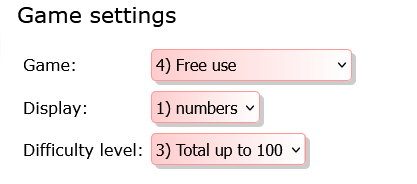 This configuration allows for a presentation to the entire class, on an IWB or video projector, as well as individual work on a problem proposed by the teacher. Vary the total or display depending on the class level and student difficulties.
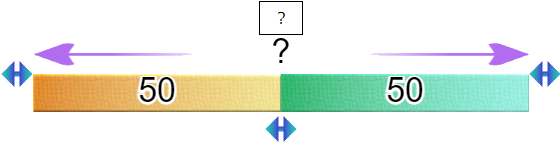
With these parameters we obtain this:
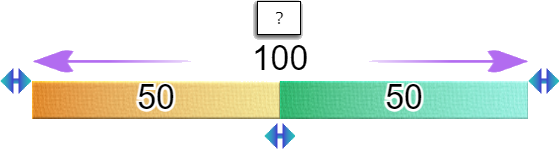
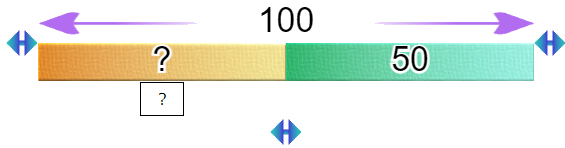
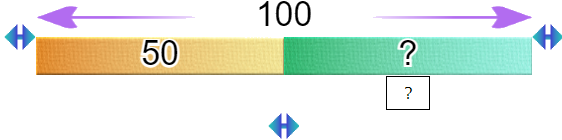
You can move the question mark to any of the three bars:
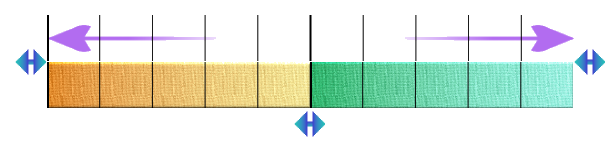
The bar diagram on Actilud is adaptable; if you are working on counting with tens, here is the 4-2-1 setting:
An approach to introducing students
The traditional approach (without digital technology) consists in gradually getting students to draw up a bar diagram, using materials such as cubes or rulers. As you can imagine, with this “artisanal” method, you have to proceed in stages, and the teacher’s intervention is essential, several times, to finally arrive at a viable diagram.
Thanks to digital technology, we can reverse the process and go much faster. The diagram on Actilud is not an abstraction , but a fully operational ” virtual machine ” that works like a calculator!
Ideally, you should use an interactive whiteboard. If you don’t have one, get a video projector. An internet connection is also required, of course. If you have a mobile classroom with computers or tablets, now’s the time to distribute them so students can experiment with the model, either individually or in small groups.
The approach suggested below is obviously not prescriptive: teachers must adapt it to suit their class and progress. However, you need to be sufficiently at ease with your class and with digital technology, to give your students plenty of freedom. Be prepared for the unexpected! If you want to control everything down to the last click, it won’t work!
First step: discovering the model – research activity
Present the model with the settings shown above. Here is the question:
It’s a “problem-solving machine”. Find out how it works. Why is it a problem-solving machine? What kinds of problems can it solve?
First, ask your students not to use the question mark. Let them search on their screens and/or imagine answers and present them on the IWB.
Pupils will easily understand the benefits of the machine, especially if they’re used to working together – otherwise it’s time to teach them.
In 1st Grade we saw pupils “pushing” the model to its limits, which made them consider the role of zero.

What’s this? But it’s 0=0+0. The zero isn’t displayed because there’s no room to write it down. This is normal: if I have zero marbles, I have “nothing”.
The expected answers
Without wishing to prejudge your students’ answers, it’s a safe bet that they’ll revolve around arithmetic. It’s a problem-solving machine, because it lets you do calculations, especially addition (and subtraction, if they already know it).
Second step: calculations and problematization
This will probably take several sessions.
Our aim is not to calculate, but to solve problems. To do this, we’re going to reverse the usual procedures – we’re going to start from the calculation to find a problem.
The calculation phase
It’s time to start adding (top bar), then subtracting with the bottom bars.
How to proceed – addition
We start with addition, we create a problem. Then we will do the same with subtraction.
To begin, the teacher places the question mark on one of the bars – so start with the top bar for addition, then change the sizes of the bars and ask the students to find the value (length) of the hidden bar.
The question is:
What is the calculation?
If students can use their tablet, they’ll find the answer value quite easily by reproducing the model. But here, the important thing is not to find the value of the answer, but the calculation that leads to this value, and that the model does not indicate:
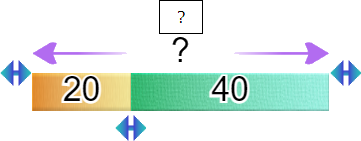
The answer can be summarized as follows (if appropriate, and if your class lends itself to it, we can tackle the two possible forms of our equation straight away – but if there is the slightest risk of confusion, take only one of the two forms):
? = 20 + 40
20 + 40 = ?
The problematization
On the same type of calculation operation, it’s important not to waste too much time and to quickly problematize. This can be done by asking students the following question:
What kind of problem can we invent with this calculation?
In the case of our operation, the expected answer is a simple Vergnaud-type problem, such as can be found on the website :
Alice has 20 marbles. She plays against Bob and wins 40. How many marbles does she have now?
With marbles, students are likely to invent a transformation problem. Of course, all types of problems are welcome! Here’s another example of a proposition, involving a composition, again with marbles:
Alice has 20 marbles, Bob has 40. How many marbles do they have altogether?
In this way, the teacher can, if he or she wishes, discuss the relevance of each proposed statement, improve it, then write it down to create an initial bank of collectively-created statements, which can then be distributed to the students.
Once students have mastered a statement, they can have fun changing the parameters, and everyone can invent their own problem, then ask the others to solve it.
How to do it – subtraction
Note that subtraction in this scheme is always addition with holes! We look at what’s missing from one bar to arrive at the total shown on the top bar.
If students haven’t yet mastered subtraction, you can leave it at the “hole addition” stage. If they have already mastered subtraction, this is the time to make them understand that addition with holes is subtraction.
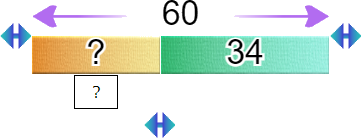
In this situation, if we start with the bar model, the question is: how much do I add to 34 to get 60?
We therefore obtain the following calculations:
60 = ? + 34
60 – 34 = ?
As before, let’s train our students to find the answers by calculation on the same situation, varying the values, and then problematize.
Here the type of problem becomes:
Alice and Bob have 60 marbles in total. Bob has 40. How many marbles does Alice have?
Repeat the process for the right-hand bar. Students will notice that, although the writing changes slightly (60 = 34+?), it’s exactly the same as for the left bar.
Step Three: solving a Given Problem
If pupils reproduce the diagram in the notebook, they will have difficulty maintaining the proportionality of the bar sizes in their drawing, especially if the numbers are large. Pupils always tend to follow the model presented to them, and will waste time in representing the bars as accurately as possible.
However, respecting the size is not important. What is, however, is writing the data in the right places. The size of a bar must appear as a number, no matter if the proportionality is not visually respected. In this way, we can gradually increase their level of abstraction.
Step Four: On-Site Training
Actilud.com , numeration and basic problems, exercise C1: states composition with diagram.
The advantage of the site is that it can force (depending on the settings) to place the data labels on the correct bars. This is useful for working on problem comprehension. The vocabulary is deliberately quite simple because the objective is primarily to allow students to solve simple problems, not to enrich their vocabulary (which can be done later, once mastery has been acquired, by proposing other problems on cards).
Thanks to the site, the teacher can very easily adapt his instructions to the level of the students:
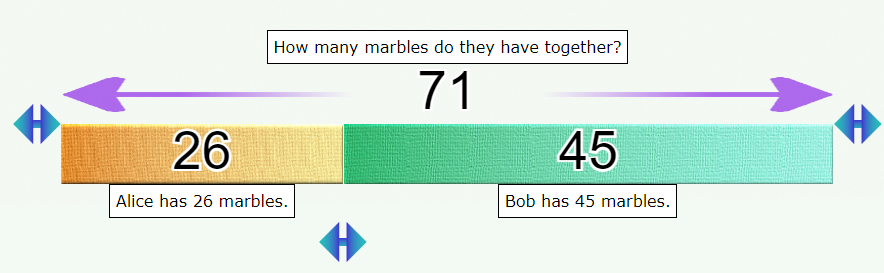
In the illustration above, the diagram is used to automatically calculate the answer. Here, the point is to work on the statement, leaving the calculations to the machine.
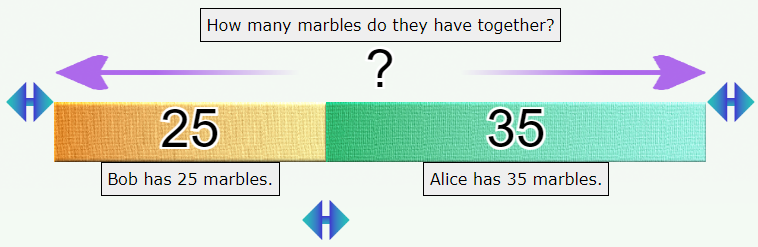
In the illustration below, on the other hand, the diagram is used to understand the statement, but the calculations are left to the student.
Fifth step (and following…)
Other types of additive problems (transformation, comparison, etc.) can be tackled using the steps outlined above. Gradually, a bank of simple problems can be built up as a reference for pupils.
Dealing with problems with larger numbers?
With the bar diagram on Actilud, the largest possible number is 100. Using the model for larger numbers is not possible, simply for ergonomic reasons. But for an introduction to problems, this is not a drawback. Once the students have understood the approach with the site and numbers under 100, they can reproduce the diagram in their notebooks with much larger numbers.