The Cartesian scheme is an alternative to the basic multiplicative scheme. It is much simpler to understand than its analogue, but it is also more limited.
Presentation
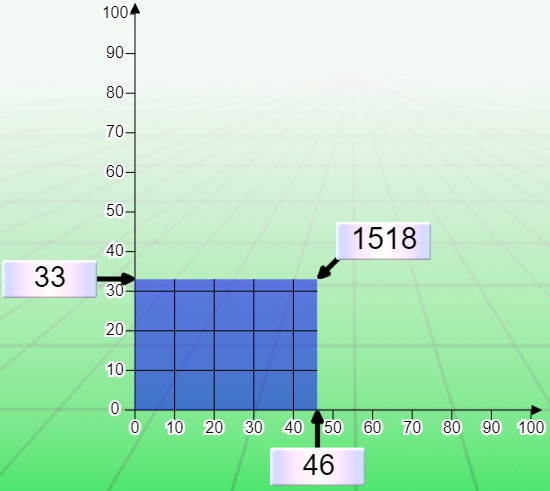
The principle of the Cartesian diagram is based on the calculation of the area of the rectangle:
A = L x L
Area equals length multiplied by width
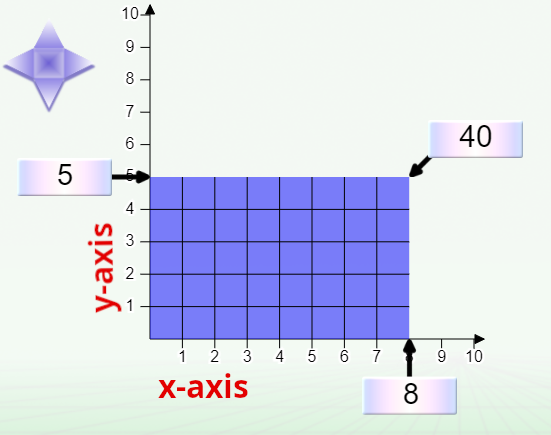 You can act on the x-axis, y-axis and area by moving the corresponding controllers. For large numbers, you can fine-tune the position to the unit using the 4-arrow star-shaped controller.
Boundaries
Unlike the “mathematical” Cartesian diagram, whose axes have infinite length, the Cartesian model, whose axes are finite, is more limited. With it, it’s not possible to find all the divisors of a number.
Consider the diagram above. We see that the axes are graduated from 0 to 10. Therefore, it is not possible to use larger values on this model. The following problem cannot be solved using this Cartesian diagram:
The 60 seats in a theater are divided into four identical rows. How many seats are there in a row?
The answer, 15, does not fit on the axes. To solve the problem, we must change the scale of the model and choose, for example, axes limited to 32. However, if the above problem can be solved, there is still a limit for values greater than 32. So, for example, modeling an operation as simple as 100 x 1 is not possible on the 32×32 model. So, for example, modeling an operation as simple as 100 x 1 is not possible on the 32×32 model.
However, all the problems suggested by Actilud can be solved with both diagrams. For this reason, the maximum value of the operands is indicated in the parameterization. but please bear this limit in mind when creating your own problems.
Interest
Rectangular distribution and combinatorial problems are much better handled by this model than by its analog, the multiplicative bar model. The multiplicative bar model organizes data into “shares” and “share size”.
Combinatorial calculations
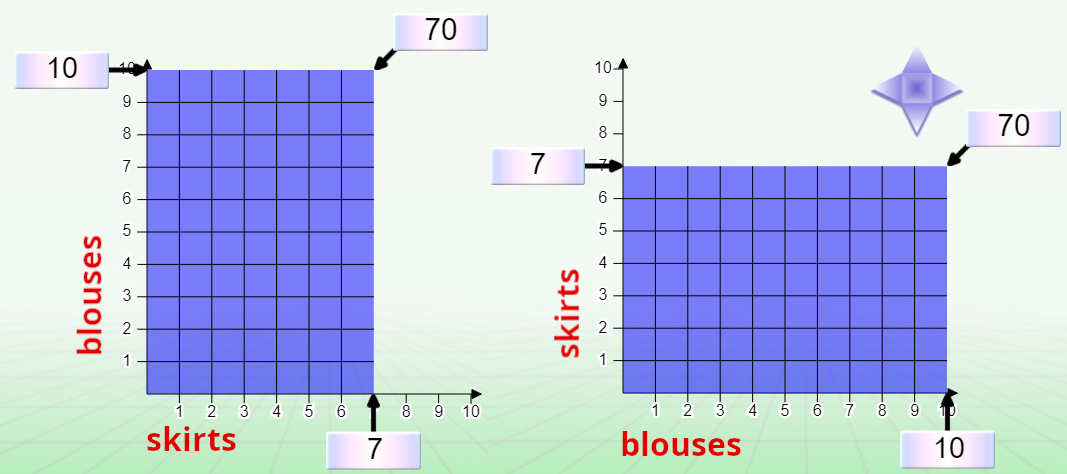
In combinatorial calculations in particular, this division makes no sense. In the problem:
How many combinations can you make with 10 blouses and 7 skirts?
The division into parts and part sizes is artificial. In the Cartesian model, it does not exist. We can use either the abscissa or ordinate axis for skirts and blouses, which gives two possible diagrams:
Rectangular configuration
In the rectangular configuration, organization into parts and number of parts is possible:
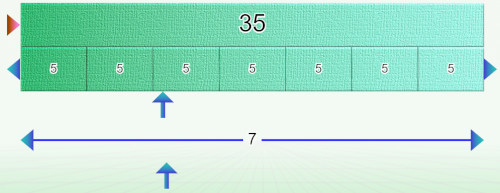
A gardener plants 7 rows of 5 lettuces. How many lettuces did he plant in total?
In the classic model, if we follow the statement to the letter, only one configuration is possible:
The row is equivalent to a share. The number of salads in the row is the size of the share.
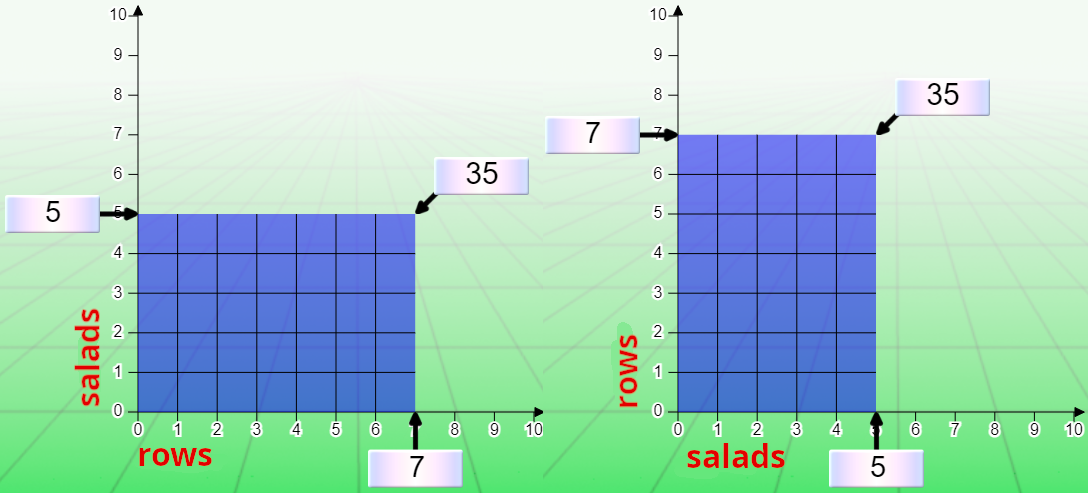
In the problem settings, if you choose the option “place labels on the diagram”, this distribution will be the only one accepted.
The Cartesian diagram, for its part, accepts both configurations:
N times more, N times less
This type of problem is treated exactly like the rectangular configuration.
Consider the following problem:
Bob saves €2. Alice saves 6 times more. How much does she save?
As with the rectangular configuration, the bar multiplication diagram only accepts one configuration: the value n times plus/minus must appear as the number of parts, i.e. 6, and the value €2 is the size of the parts.
In the Cartesian diagram, the position of the numbers on the x-axis or y-axis is not important. There are therefore two possible representations.
Introduction to the model
Count the boxes first
That’s the whole point of this model. Initially, we count the number of squares to arrive at the conclusion that the number of squares is given by the multiplication of the x-axis and y-axis values.
So, to begin with, we work on the simplest model, with axes limited to 10. The area is then cut into 1×1 squares, i.e. unit squares. The problem of salads and rows then becomes very easy to understand, if we assimilate each tile to a salad. Combinatorial problems are made easier, since each tile corresponds to a combination.
Of course, the model is also a good preparation for calculating the area of the rectangle. In fact, it will be very easy to introduce the length x width formula if students have already encountered this situation at school.
Be careful, however, not to perpetuate counting. Pupils must be encouraged to calculate the area very quickly, otherwise it will be difficult to change scale.
Ladder crossing
On larger axes, the tiles are made up of 10 x 10 units. Each tile therefore represents 100 units. Students should be made aware of this change in scale by first working with the 10×10 area in a problem on a Cartesian diagram limited to 10, and then repeating the same problem on a larger diagram (100 by 100 is ideal) where one tile corresponds to the 10 x 10 tiles in the previous diagram. If, at this point, students are still counting the number of tiles, the answer should be multiplied by 100.
On larger axes, the tiles are made up of 10 x 10 units. Each tile therefore represents 100 units. Students’ attention should be drawn to this change of scale by first dealing with the 10×10 area in a problem on a Cartesian diagram limited to 10, and then repeating the same problem on a larger diagram (100 by 100 is ideal) where one tile corresponds to the 10 x 10 tiles of the previous diagram. If, at this stage, students are still counting the number of squares, multiply the answer by 100.
Note, however, that some tiles may well be incomplete, as in the illustration below:
Transition from one scheme to another

In problems, you can easily switch between diagrams by clicking on this icon.
Conclusion: flexibility
Allowing students to choose the most appropriate diagram for solving a problem develops intellectual flexibility and limits dependence on a given model. What’s more, this new approach can unblock students who have difficulty understanding the other model.
Even if it can be restrictive at first, varying representations is an opening: we show that the same situation can be modeled in several ways. It’s a step towards greater mental agility. Don’t forget, too, that while students should be able to use both representations, they are also entitled to have preferences when it comes to choosing the model. Our ultimate goal is to dispense with models altogether, thanks to systematic, well-organized training.